📱 For the best experience, please use a desktop browser.
ArXiv Preprint

Chorus 🎶

Beyond Few-Step Inference: Accelerating Video Diffusion Transformer Model Serving with Inter-Request Caching Reuse

1 Sun Yat-sen University    2 Independent Researcher    * Corresponding author

Abstract

Video Diffusion Transformer (DiT) models are a dominant approach for high-quality video generation but suffer from high inference cost due to iterative denoising. Existing caching approaches primarily exploit similarity within the diffusion process of a single request to skip redundant denoising steps. In this paper, we introduce Chorus, a caching approach that leverages similarity across requests to accelerate video diffusion model serving. Chorus achieves up to 45% speedup on industrial 4-step distilled models, where prior intra-request caching approaches are ineffective. Particularly, Chorus employs a three-stage caching strategy along the denoising process: Stage 1 performs full reuse of latent features from similar requests. Stage 2 exploits inter-request caching in specific latent regions during intermediate denoising steps, combined with Token-Guided Attention Amplification (TGAA) to improve semantic alignment. Stage 3 operates in the final steps and disables caching reuse to repair discontinuities.

Introduction

Video DiT models like Wan and HunyuanVideo produce high-quality videos but are prohibitively expensive. Chorus introduces inter-request caching reuse to break this bottleneck.
Chorus Introduction
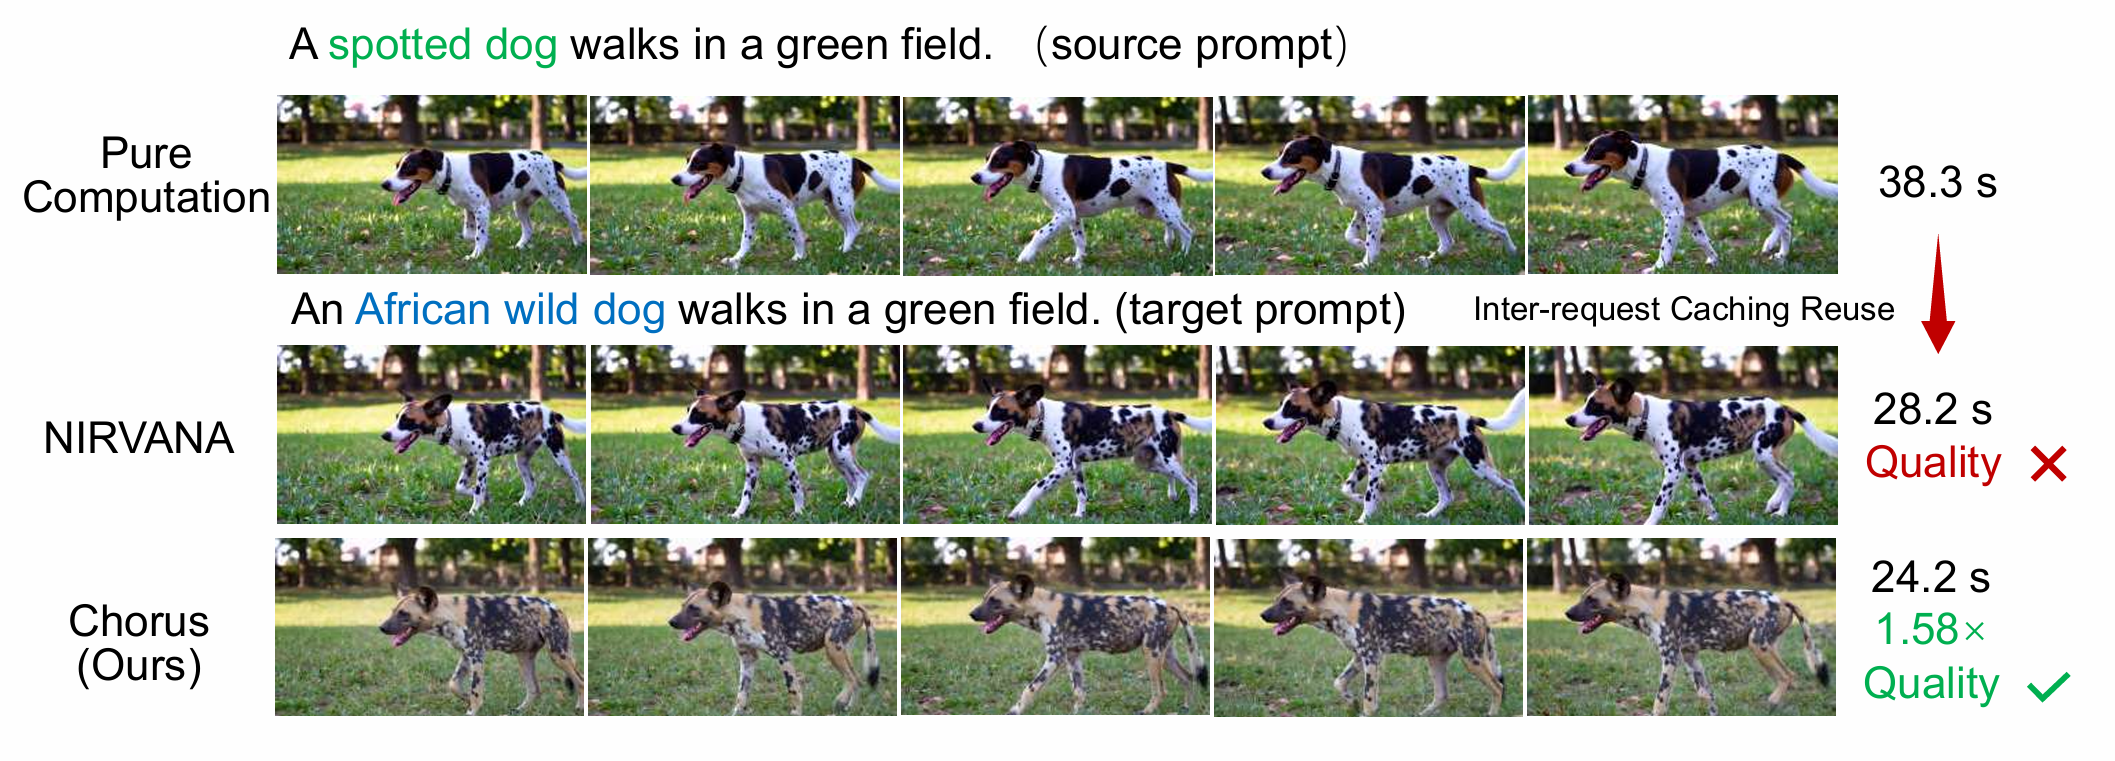
Figure 1. Video generation illustration of Chorus on a distilled 4-step Wan2.1 model. Chorus reuses cached latent states from a semantically similar request, significantly accelerating inference while maintaining accurate semantic generation.

💡 Key Insight

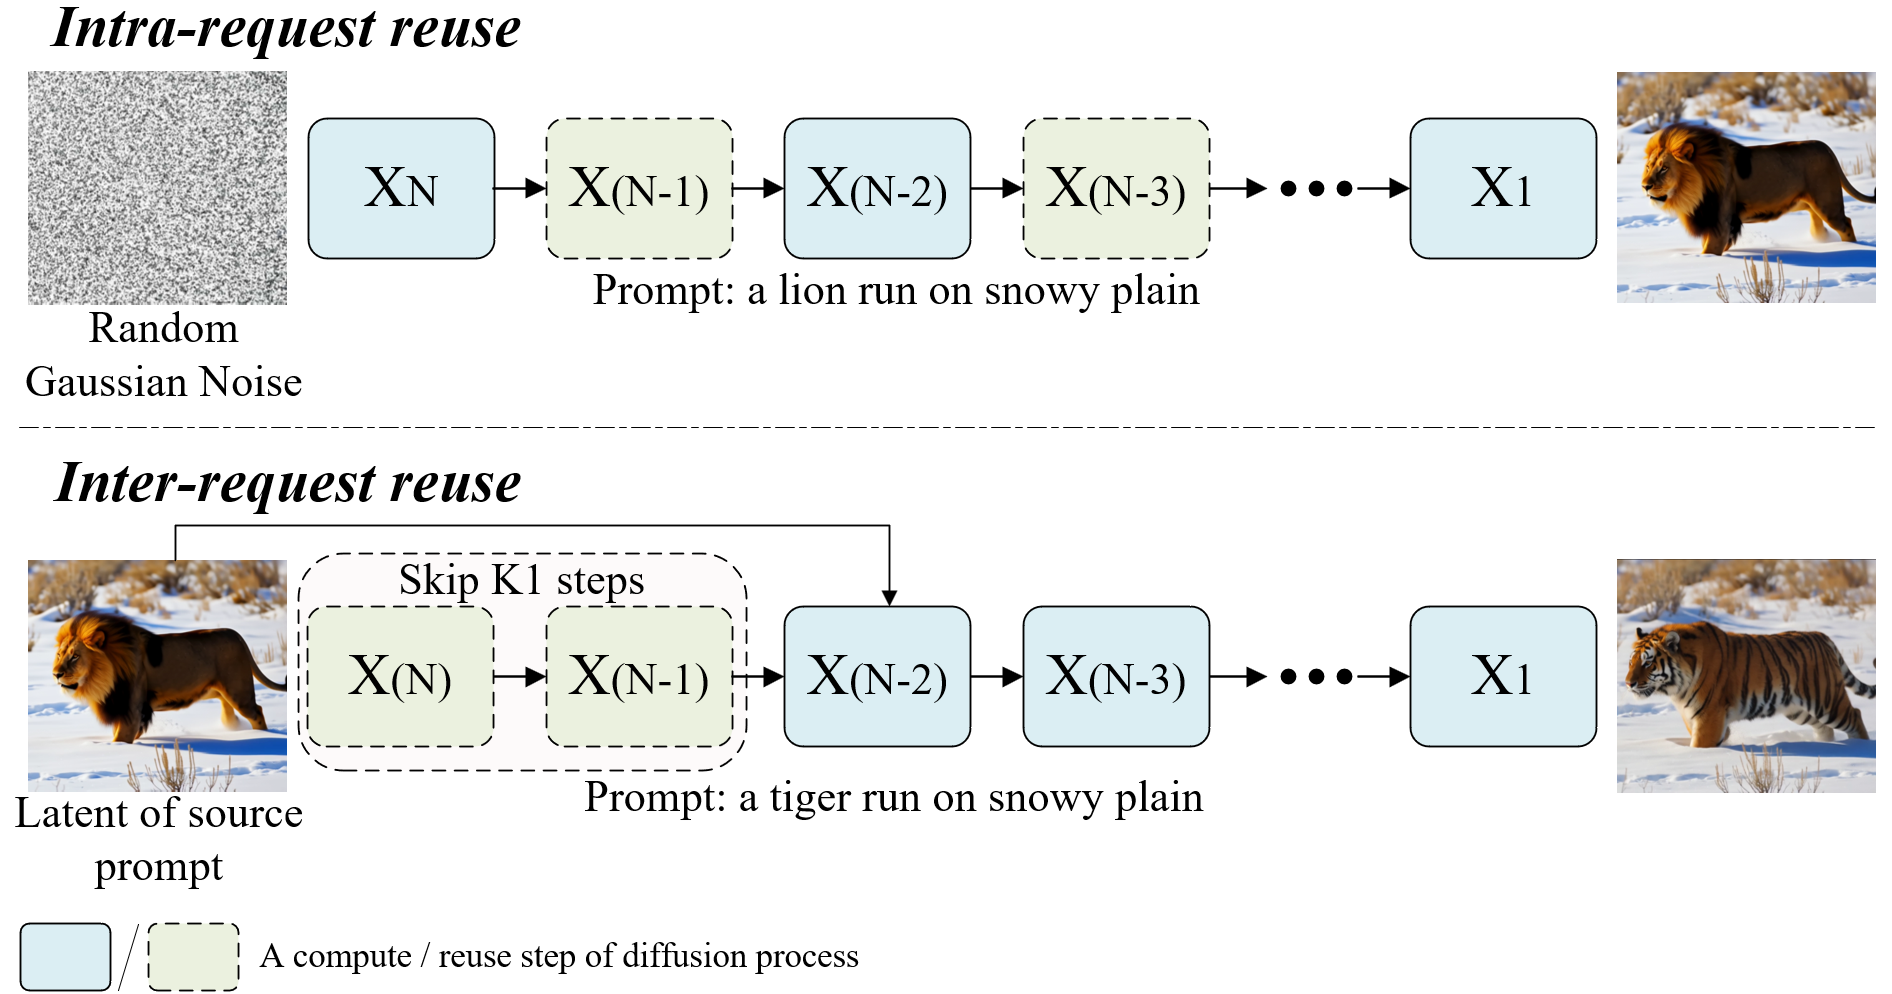
While intra-request caching exploits similarity within a single denoising process, Chorus exploits similarity across different requests. This makes it effective even on 4-step distilled models where intra-request redundancy has been largely removed. Moreover, Chorus is orthogonal to distillation and intra-request caching — combining them yields multiplicative speedups.
Intra vs Inter Request Reuse
Figure 2. Illustration of intra- and inter-request caching reuse, with denoising timesteps explicitly expanded. Inter-request reuse leverages similarity across different user requests.
Method

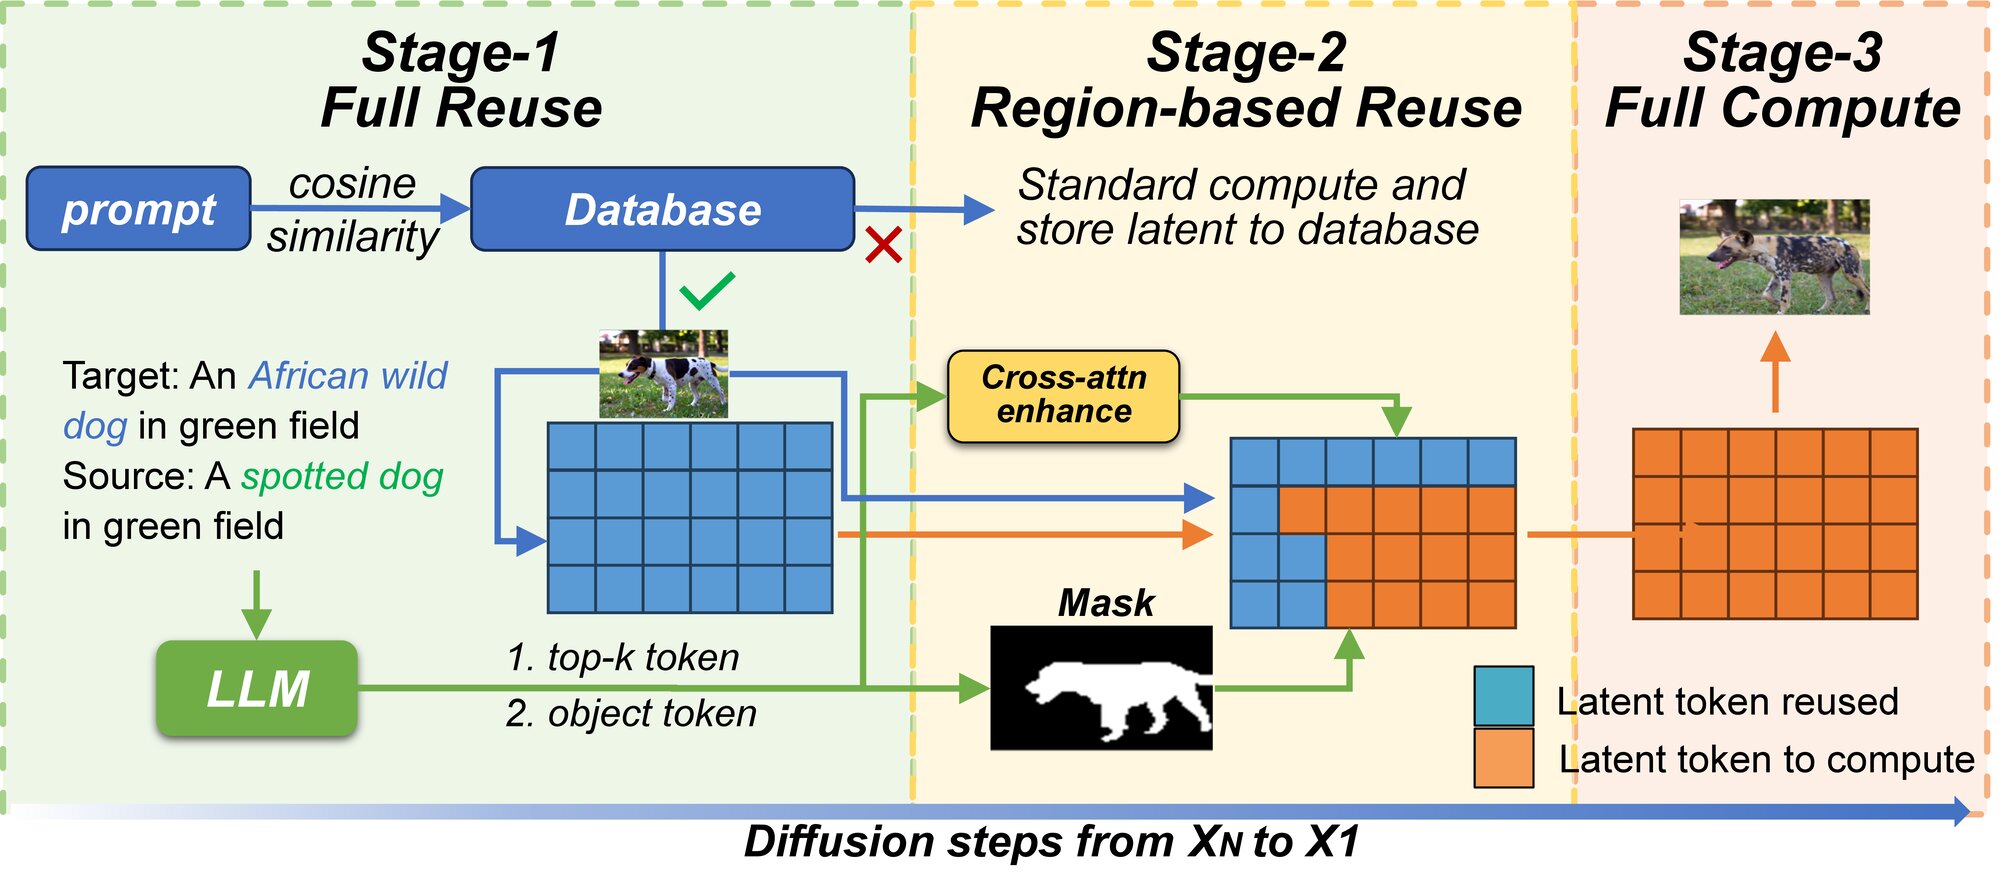
Chorus partitions the denoising process into three stages with progressively finer-grained reuse strategies.

Chorus Overview
Figure 3. Chorus Overview — Three-stage inter-request caching reuse framework.
1

Full Reuse

Retrieves cached source requests whose CLIP embeddings exhibit the highest cosine similarity to the target prompt. Upon a successful match, reuses latent features from the matched source for initial denoising steps.

2

Selective Region Reuse

Selectively computes regions that differ between target and source prompts while reusing latent features for semantically similar regions. Combined with TGAA to improve semantic alignment.

3

Full Compute

Performs full computation in the final denoising steps to repair discontinuities introduced by mask-driven acceleration and to refine fine-grained details.

🎯 Token-Guided Attention Amplification (TGAA)

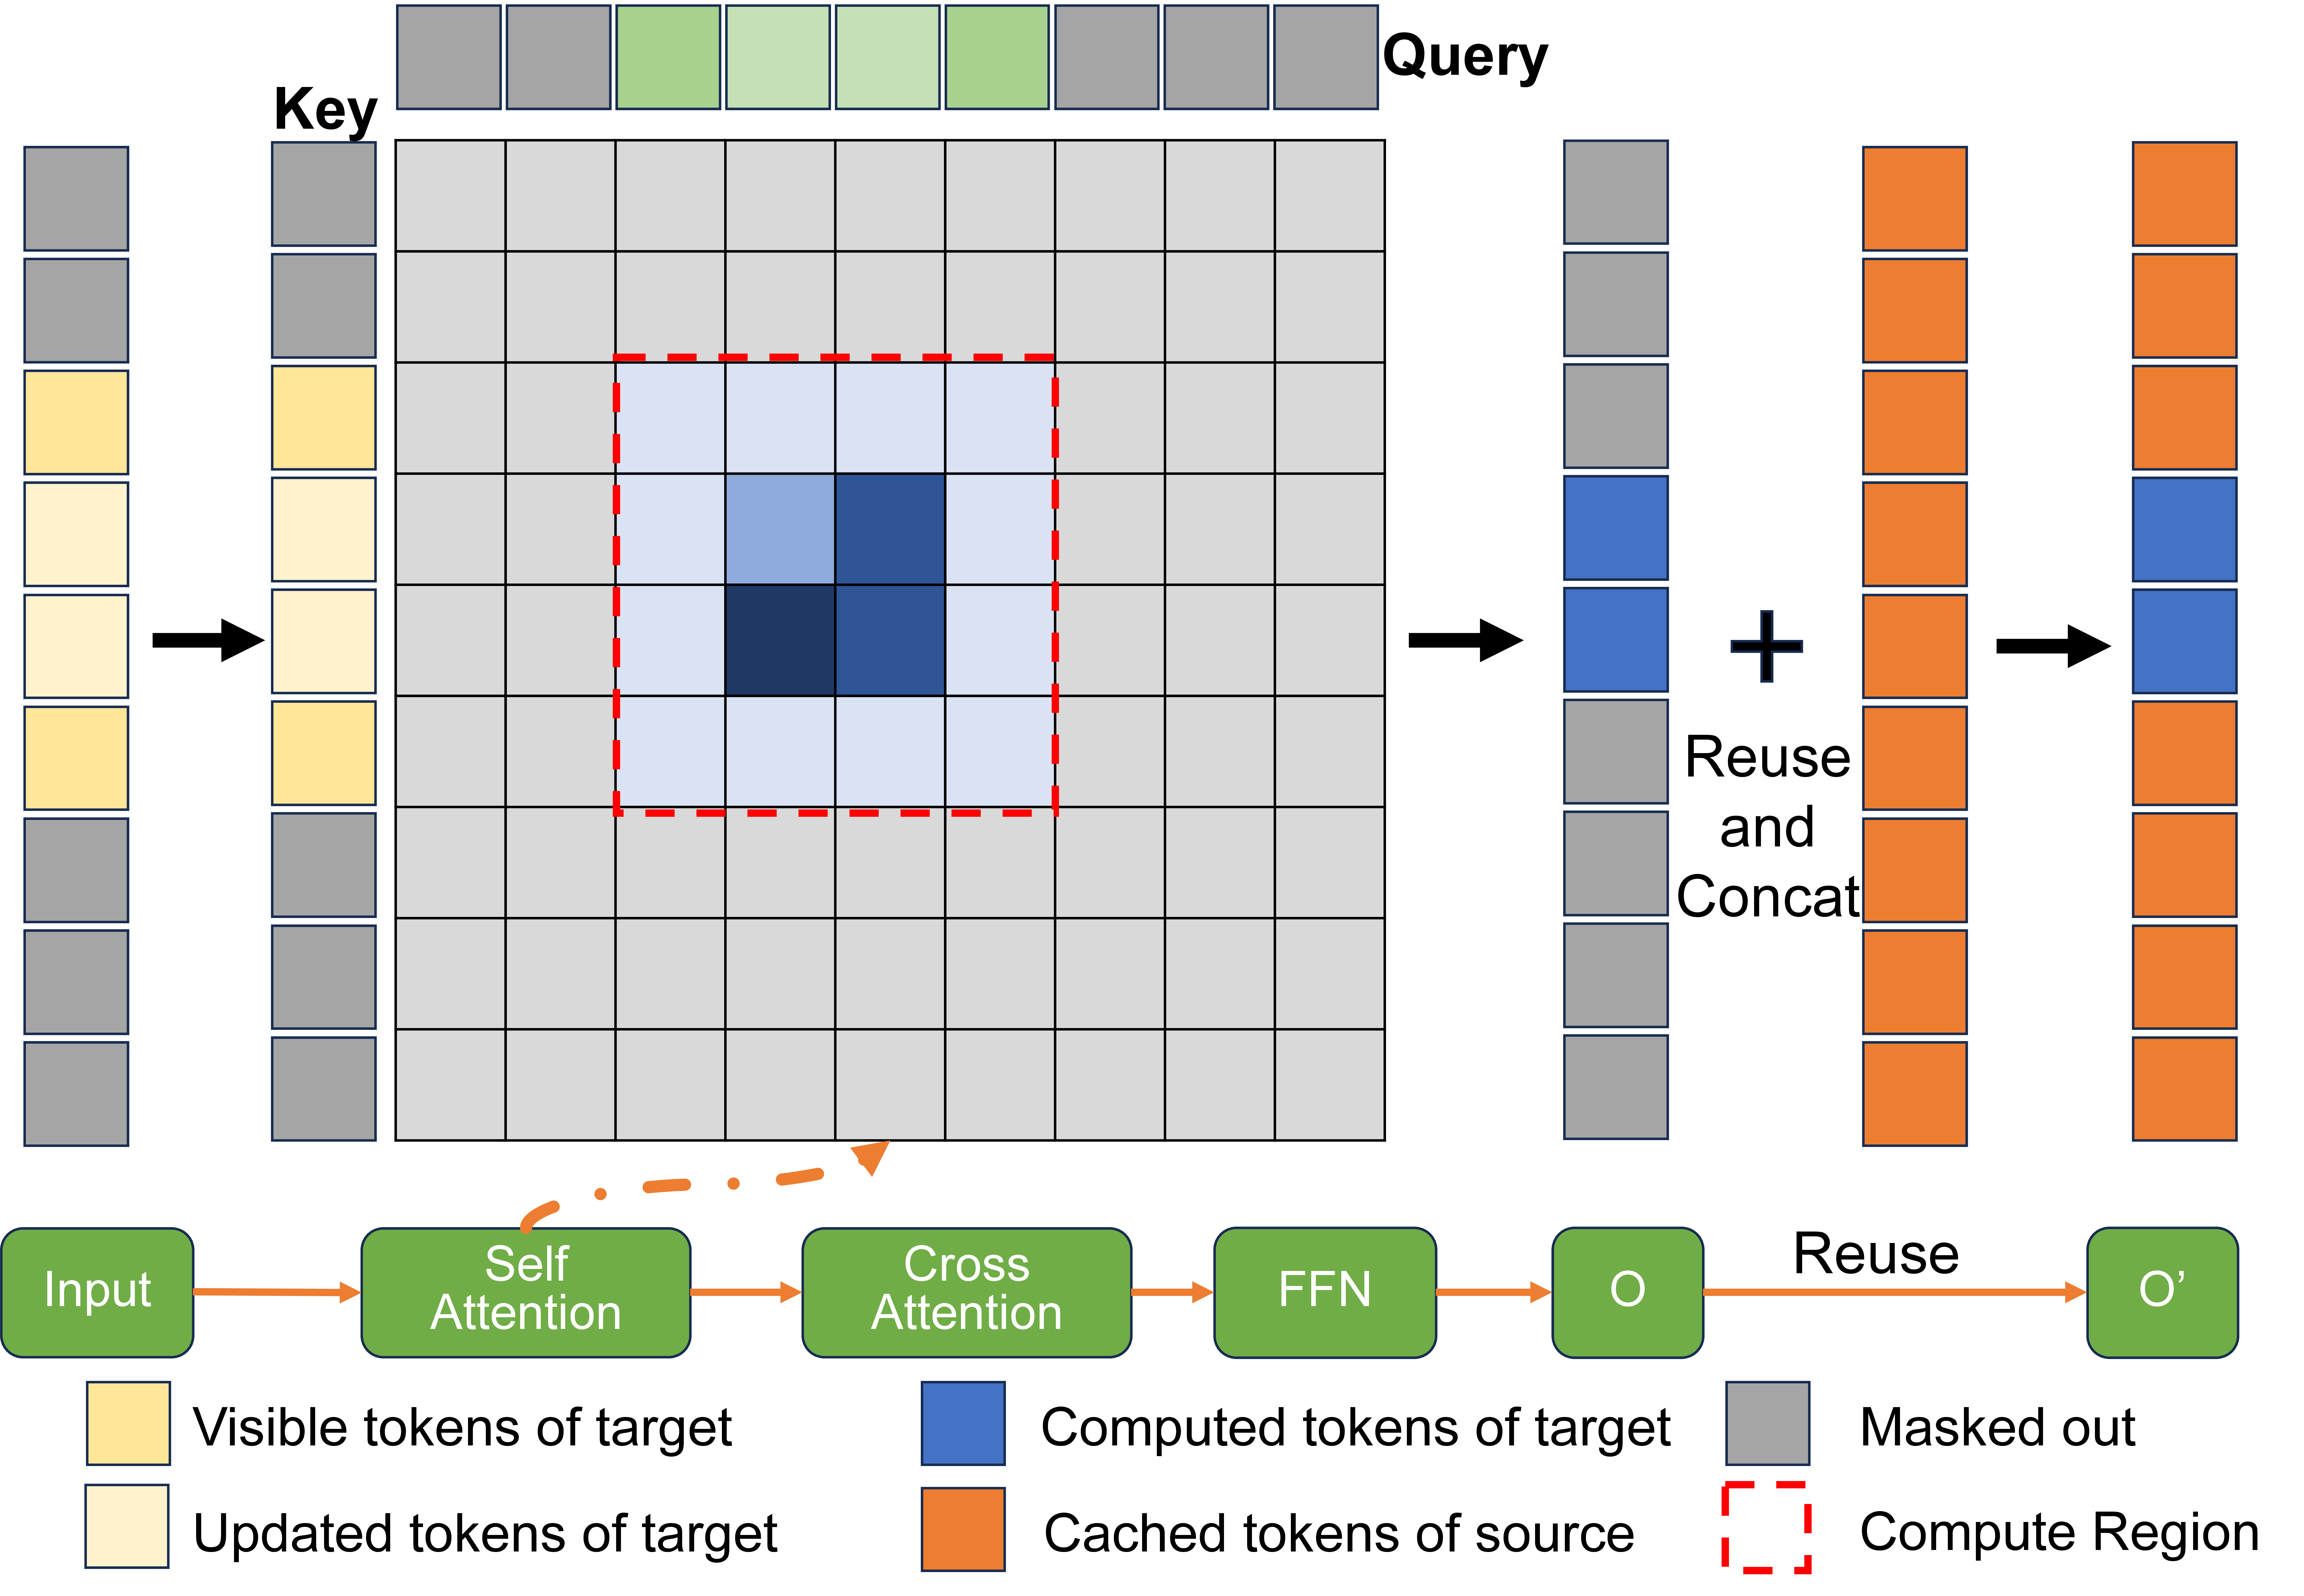
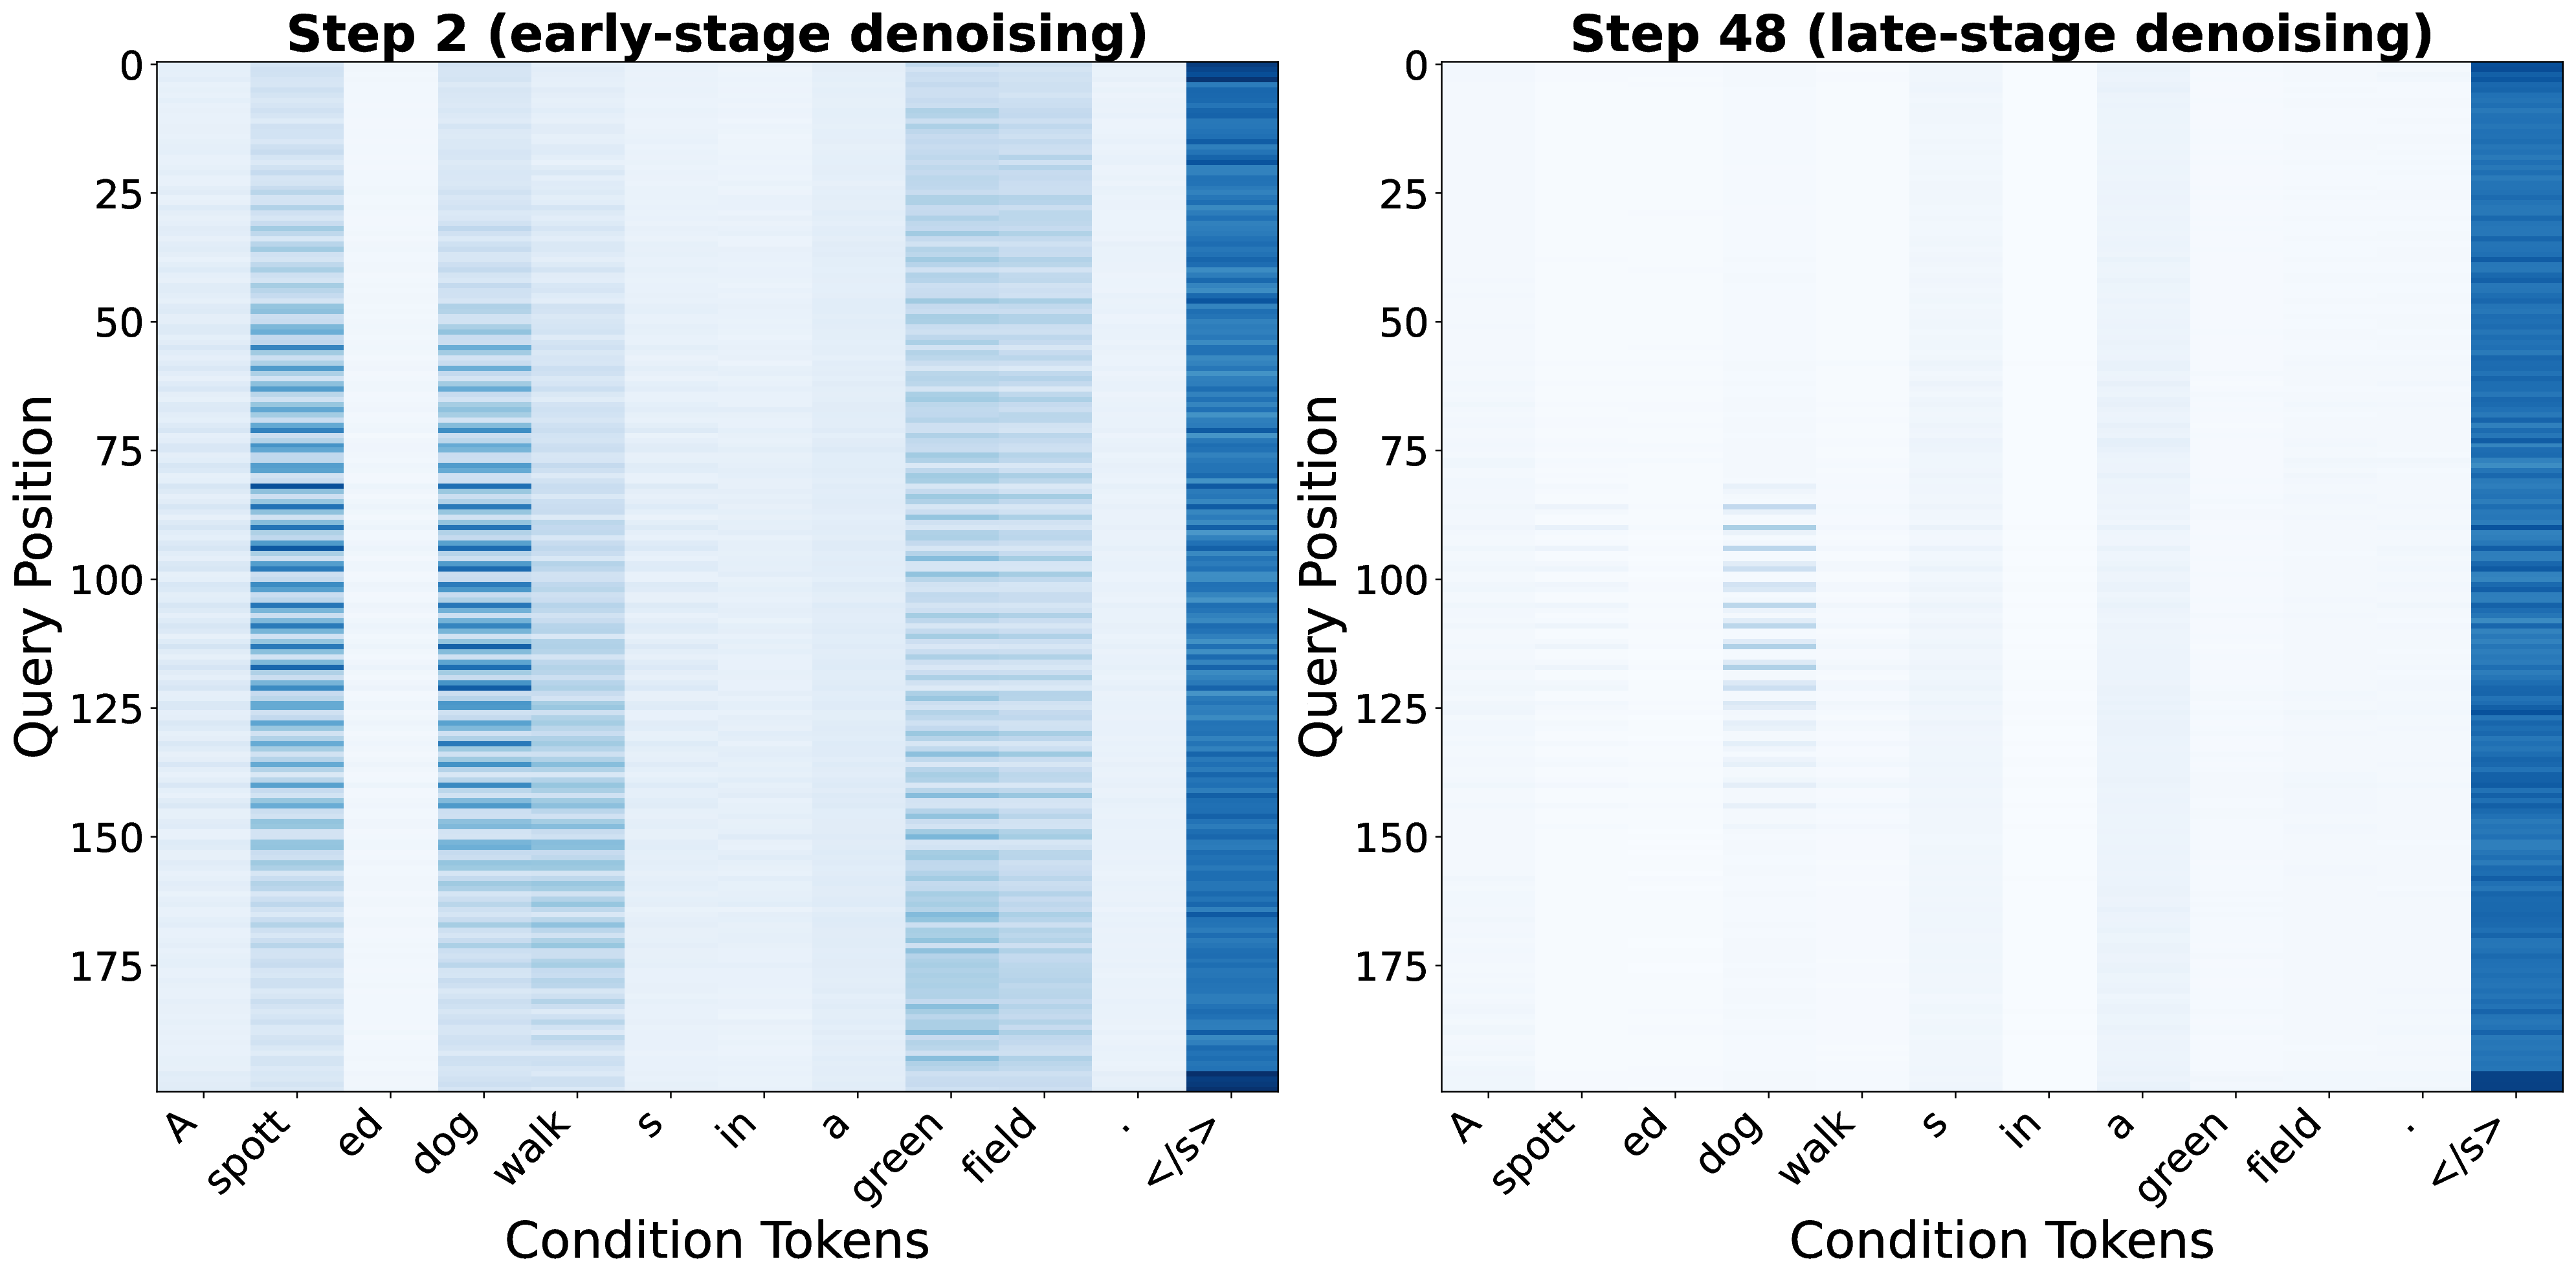
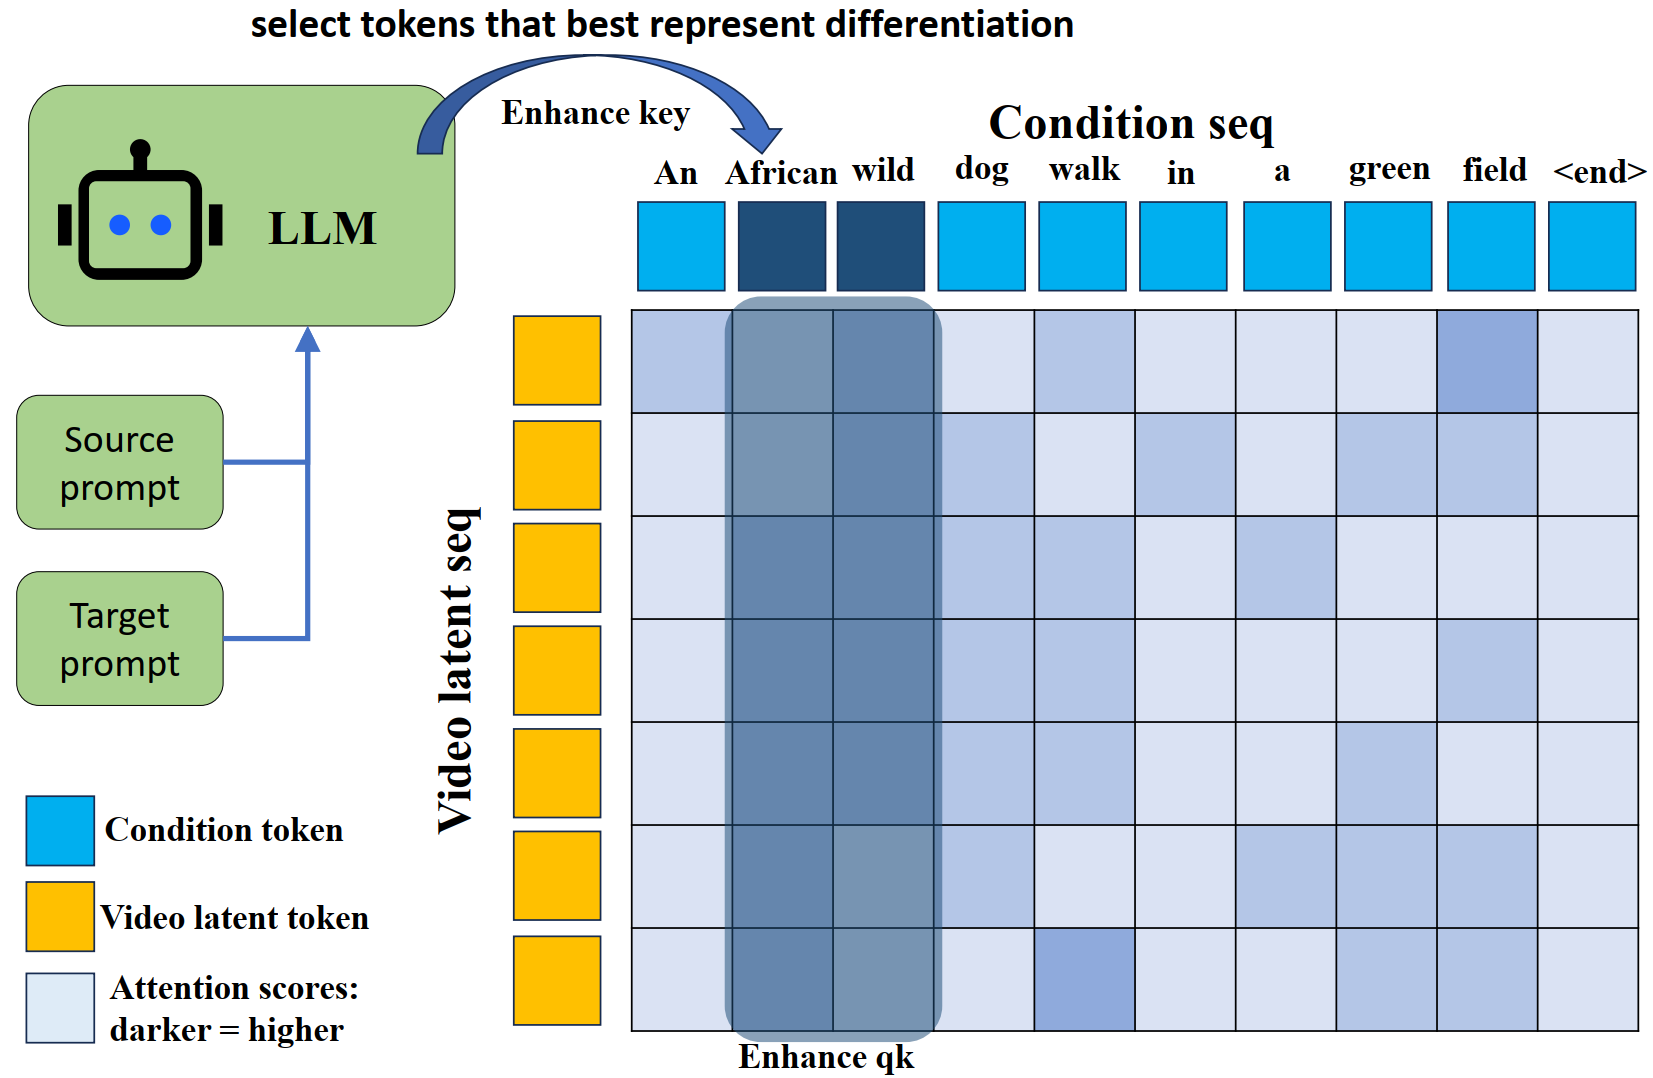
When extending inter-request latent reuse from image to video generation, reused video latents tend to preserve attributes of the source prompt instead of fully adapting to the target prompt. TGAA addresses this by adaptively identifying tokens with the most significant semantic shifts and selectively amplifying their influence in cross-attention.

TGAA Illustration
Illustration of key amplification in TGAA — dynamically amplifying key vectors of condition tokens that capture semantic differences.

🔍 Selective Region Denoising (SRD)

SRD adopts a fine-grained strategy to enable partial caching reuse: it persistently reuses well-aligned regions and restricts recomputation exclusively to divergent regions. A hierarchical mask system (base, edit, visible) ensures smooth transitions between reused and recomputed areas.

SRD Illustration
Selective Region Denoising — Reuse background, recompute divergent object region.
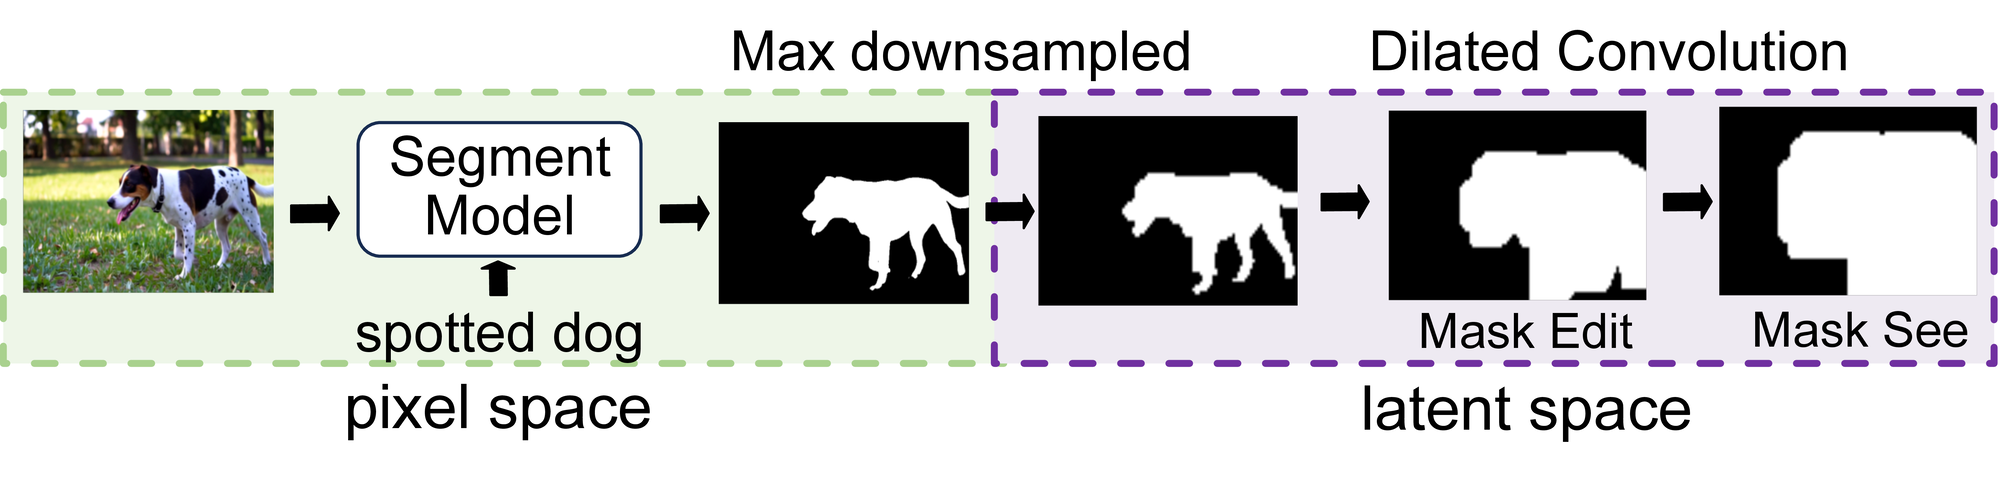
Mask Generation
Mask Generation Pipeline — Object extraction → Segmentation → Latent projection.

Experimental Results

Chorus is evaluated on three Wan2.1 text-to-video variants with both cold-start and warm-start caches.

Quantitative comparison on Wan2.1 text-to-video models. (0)/(1k) denote cold-start and warm-start caches.
Method CLIP-SCORE ↑ VBench-q ↑ Latency(s) ↓ Hit Latency(s) ↓ Speedup ↑ Speedup(hit) ↑ Hit Rate
Wan2.1-14B-T2V-distilled (81 frames, 480P, 4 steps, no CFG)
Baseline 31.9970 0.9000 64.15 1.00× 1.00×
NIRVANA (0) 31.3038 0.8993 56.75 46.37 1.13× 1.38× 42.6%
Chorus (0) 31.5006 0.9005 55.91 44.51 1.15× 1.44× 42.6%
NIRVANA (1k) 31.0635 0.8991 53.79 46.93 1.19× 1.37× 58.9%
Chorus (1k) 31.3081 0.9006 52.09 44.15 1.23× 1.45× 58.9%
Wan2.1-14B-T2V (81 frames, 480P, 50 steps)
Baseline 31.3764 0.8976 1683.1 1.00× 1.00×
NIRVANA (1k) 29.6641 0.8962 1381.2 1277.88 1.22× 1.32× 58.0%
TeaCache (l=0.2) 31.4445 0.8971 1082.1 1.55×
Chorus (1k) 30.5598 0.8987 1339.2 1206.69 1.26× 1.39× 58.0%
Chorus (1k) + TeaCache 30.4624 0.8983 866.4 782.24 1.94× 2.15× 58.0%
Wan2.1-1.3B-T2V (81 frames, 480P, 50 steps)
Baseline 30.3637 0.8954 319.01 1.00× 1.00×
NIRVANA (1k) 29.0643 0.8945 261.46 245.72 1.22× 1.30× 58.0%
TeaCache (l=0.2) 30.3580 0.8940 114.68 2.78×
Chorus (1k) 29.7352 0.8912 251.62 226.08 1.27× 1.41× 58.0%
Chorus (1k) + TeaCache 29.5147 0.8868 103.09 89.16 3.09× 3.58× 58.0%

Key Insights

Cross-Model Results

Chorus generalizes beyond Wan2.1 — we validate it on HunyuanVideo-1.5.

Table R1: Results on HunyuanVideo-1.5 (81 frames, 480P, 400 hit prompts)
Method Latency (s) ↓ Speedup ↑ CLIP-Score ↑ VBench-q ↑ VQAScore ↑
50-step (full) 800.1 31.15 0.8920 0.6140
4-step distilled (baseline) 44.0 1.00× 30.98 0.8995 0.6049
NIRVANA 34.2 1.29× 30.43 0.9006 0.5552
Chorus (ours) 30.1 1.46× 30.96 0.8998 0.5730

💡 Cross-Model Transferability

On HunyuanVideo-1.5, Chorus achieves 1.46× speedup over the distilled baseline with only 0.02 CLIP-Score loss — closely matching the acceleration gains observed on Wan2.1. Compared to NIRVANA, Chorus delivers both higher CLIP-Score (30.96 vs 30.43) and better VQAScore (0.5730 vs 0.5552), confirming superior semantic preservation.

Human Evaluation

We conducted a human study with 25 volunteers evaluating 100 video-text samples from full generation, NIRVANA, and Chorus.

94%
Chorus results rated as
semantically acceptable
100/100
Pairwise comparisons where
Chorus preferred over NIRVANA
25
Volunteer evaluators
per sample
100
Video-text pairs
evaluated

Visual Results

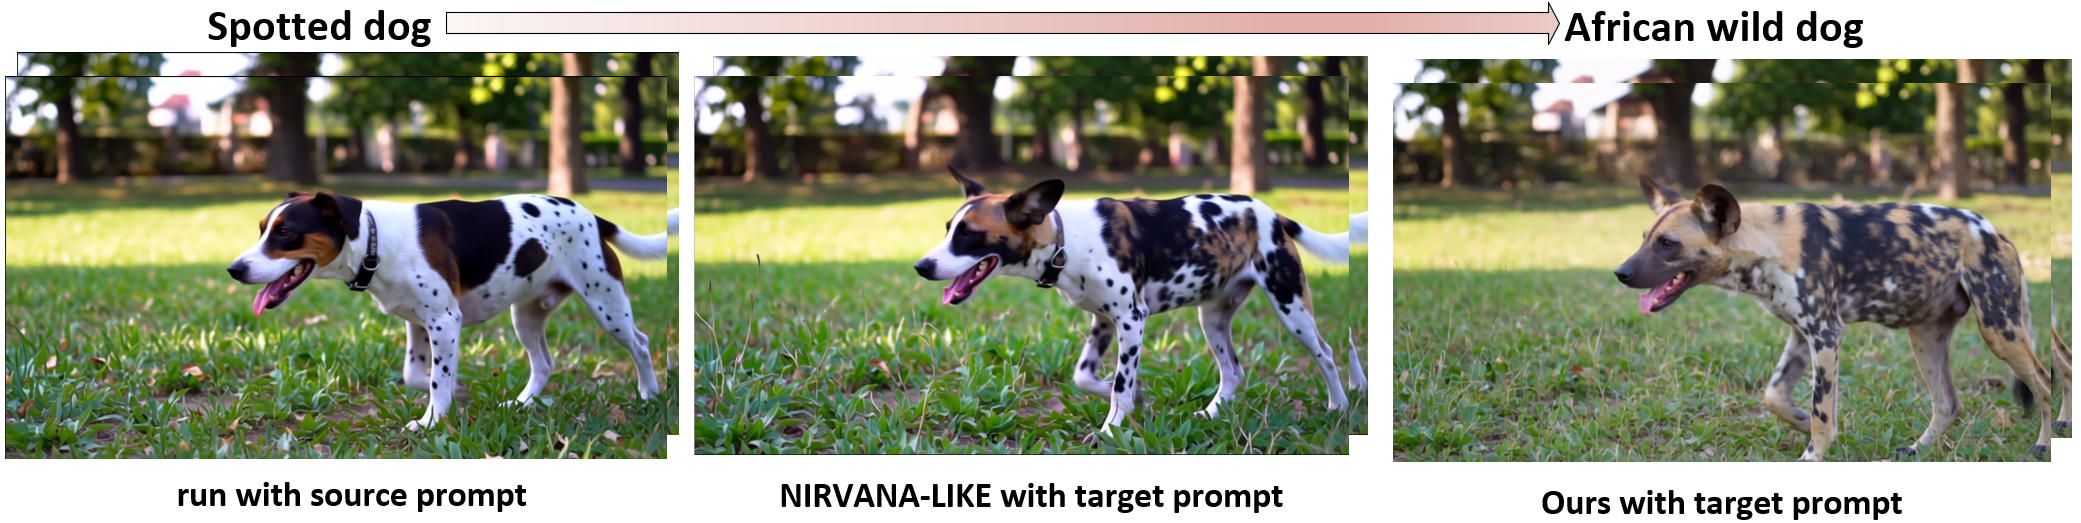
Qualitative results on Wan2.1-T2V-14B showing the generation quality of Chorus with inter-request caching reuse.

Visual Result - Wild Dog
Visual comparison. Chorus successfully transforms the semantic content (e.g., "spotted dog" → "African wild dog") while maintaining high visual quality and temporal consistency.

Video Comparisons

Side-by-side video comparisons between source generation, NIRVANA, and Chorus (Ours).

Group 1
Source: "A spotted dog walks in the garden." → Target: "An African wild dog walks in the garden."
Source (No Optimization)
NIRVANA
Chorus (Ours)
Group 2
Source: "A lion runs in the snow." → Target: "A tiger runs in the snow."
Source (No Optimization)
NIRVANA
Chorus (Ours)
Group 3
Source: "Two old men and a young child walking down the road." → Target: "Two old men walking down a road, accompanied by a donkey."
Source (No Optimization)
NIRVANA
Chorus (Ours)

Generalization Analysis

We analyze real-world workload locality using VidProM (1.67M prompts) and evaluate Chorus's sensitivity to varying locality levels.

Table A: Real video trace locality characterization (VidProM, Dec 2023, 1.67M prompts)
Metric Value
Mean nearest-prior similarity 0.769
Fraction with similarity ≥ 0.60 92.89%
Fraction with similarity ≥ 0.70 74.08%
Fraction with similarity ≥ 0.75 59.60%
Fraction with similarity ≥ 0.80 42.30%
Fraction with similarity ≥ 0.90 10.31%

🌍 Real-World Locality Confirmation

Over 74% of real video-generation requests in VidProM find a prior request with cosine similarity ≥ 0.70, and the mean nearest-prior similarity reaches 0.769. This confirms that workload locality is not an artifact of controlled evaluation, but a clearly observable statistical property of production video generation workloads.

Table B: Sensitivity of Chorus to workload locality (Wan2.1-14B-distilled, 81 frames, 480P)
Workload Mean Sim. Hit Rate Avg Latency (s) Speedup ↑ CLIP-Score
(Chorus / Baseline)
VBench-q
(Chorus / Baseline)
Very low locality 0.60 7% 62.8 1.02× 31.98 / 31.99 0.9000 / 0.9000
Low locality 0.70 48% 54.7 1.17× 32.28 / 32.31 0.8997 / 0.8996
Medium locality 0.75 72% 50.2 1.28× 31.91 / 32.30 0.8995 / 0.8999
High locality 0.80 84% 47.8 1.34× 31.94 / 32.48 0.8998 / 0.8997
Very high locality 0.90 98% 45.0 1.43× 31.56 / 32.30 0.8995 / 0.8996

📈 Graceful Degradation under Low Locality

As workload locality increases from 0.60 to 0.90, speedup improves monotonically from 1.02× to 1.43×. Crucially, under low-locality scenarios the worst case is reduced acceleration — not quality degradation. At the realistic VidProM locality level (mean 0.769 ≈ medium), Chorus still achieves 1.28× average speedup.

Ablation Studies

We ablate three key factors in Chorus: TGAA, SRD, and cache capacity.

Ablation of TGAA
Method CLIP ↑ VBench-q ↑ Speedup ↑
Baseline 31.76 0.8995 1.00×
Stage-1 only 30.51 0.8988 1.37×
+ TGAA (output) 30.59 0.9014 1.37×
+ TGAA (key) 30.80 0.8987 1.37×
+ TGAA (both) 30.80 0.9013 1.37×
Ablation of SRD
Method Compute% CLIP ↑ Speedup ↑
w/o SRD 100% 30.80 1.37×
SRD (12,20) 90.9% 30.77 1.42×
SRD (8,14) 83.8% 30.75 1.43×
SRD (0,0) 38.4% 30.32 1.60×
TGAA Sensitivity
Sensitivity of TGAA amplification factors. (a) Over-amplified keys hurt motion. (b) Over-amplified outputs add artifacts. (c) Under-amplification fails to steer semantics.
Cache Growth
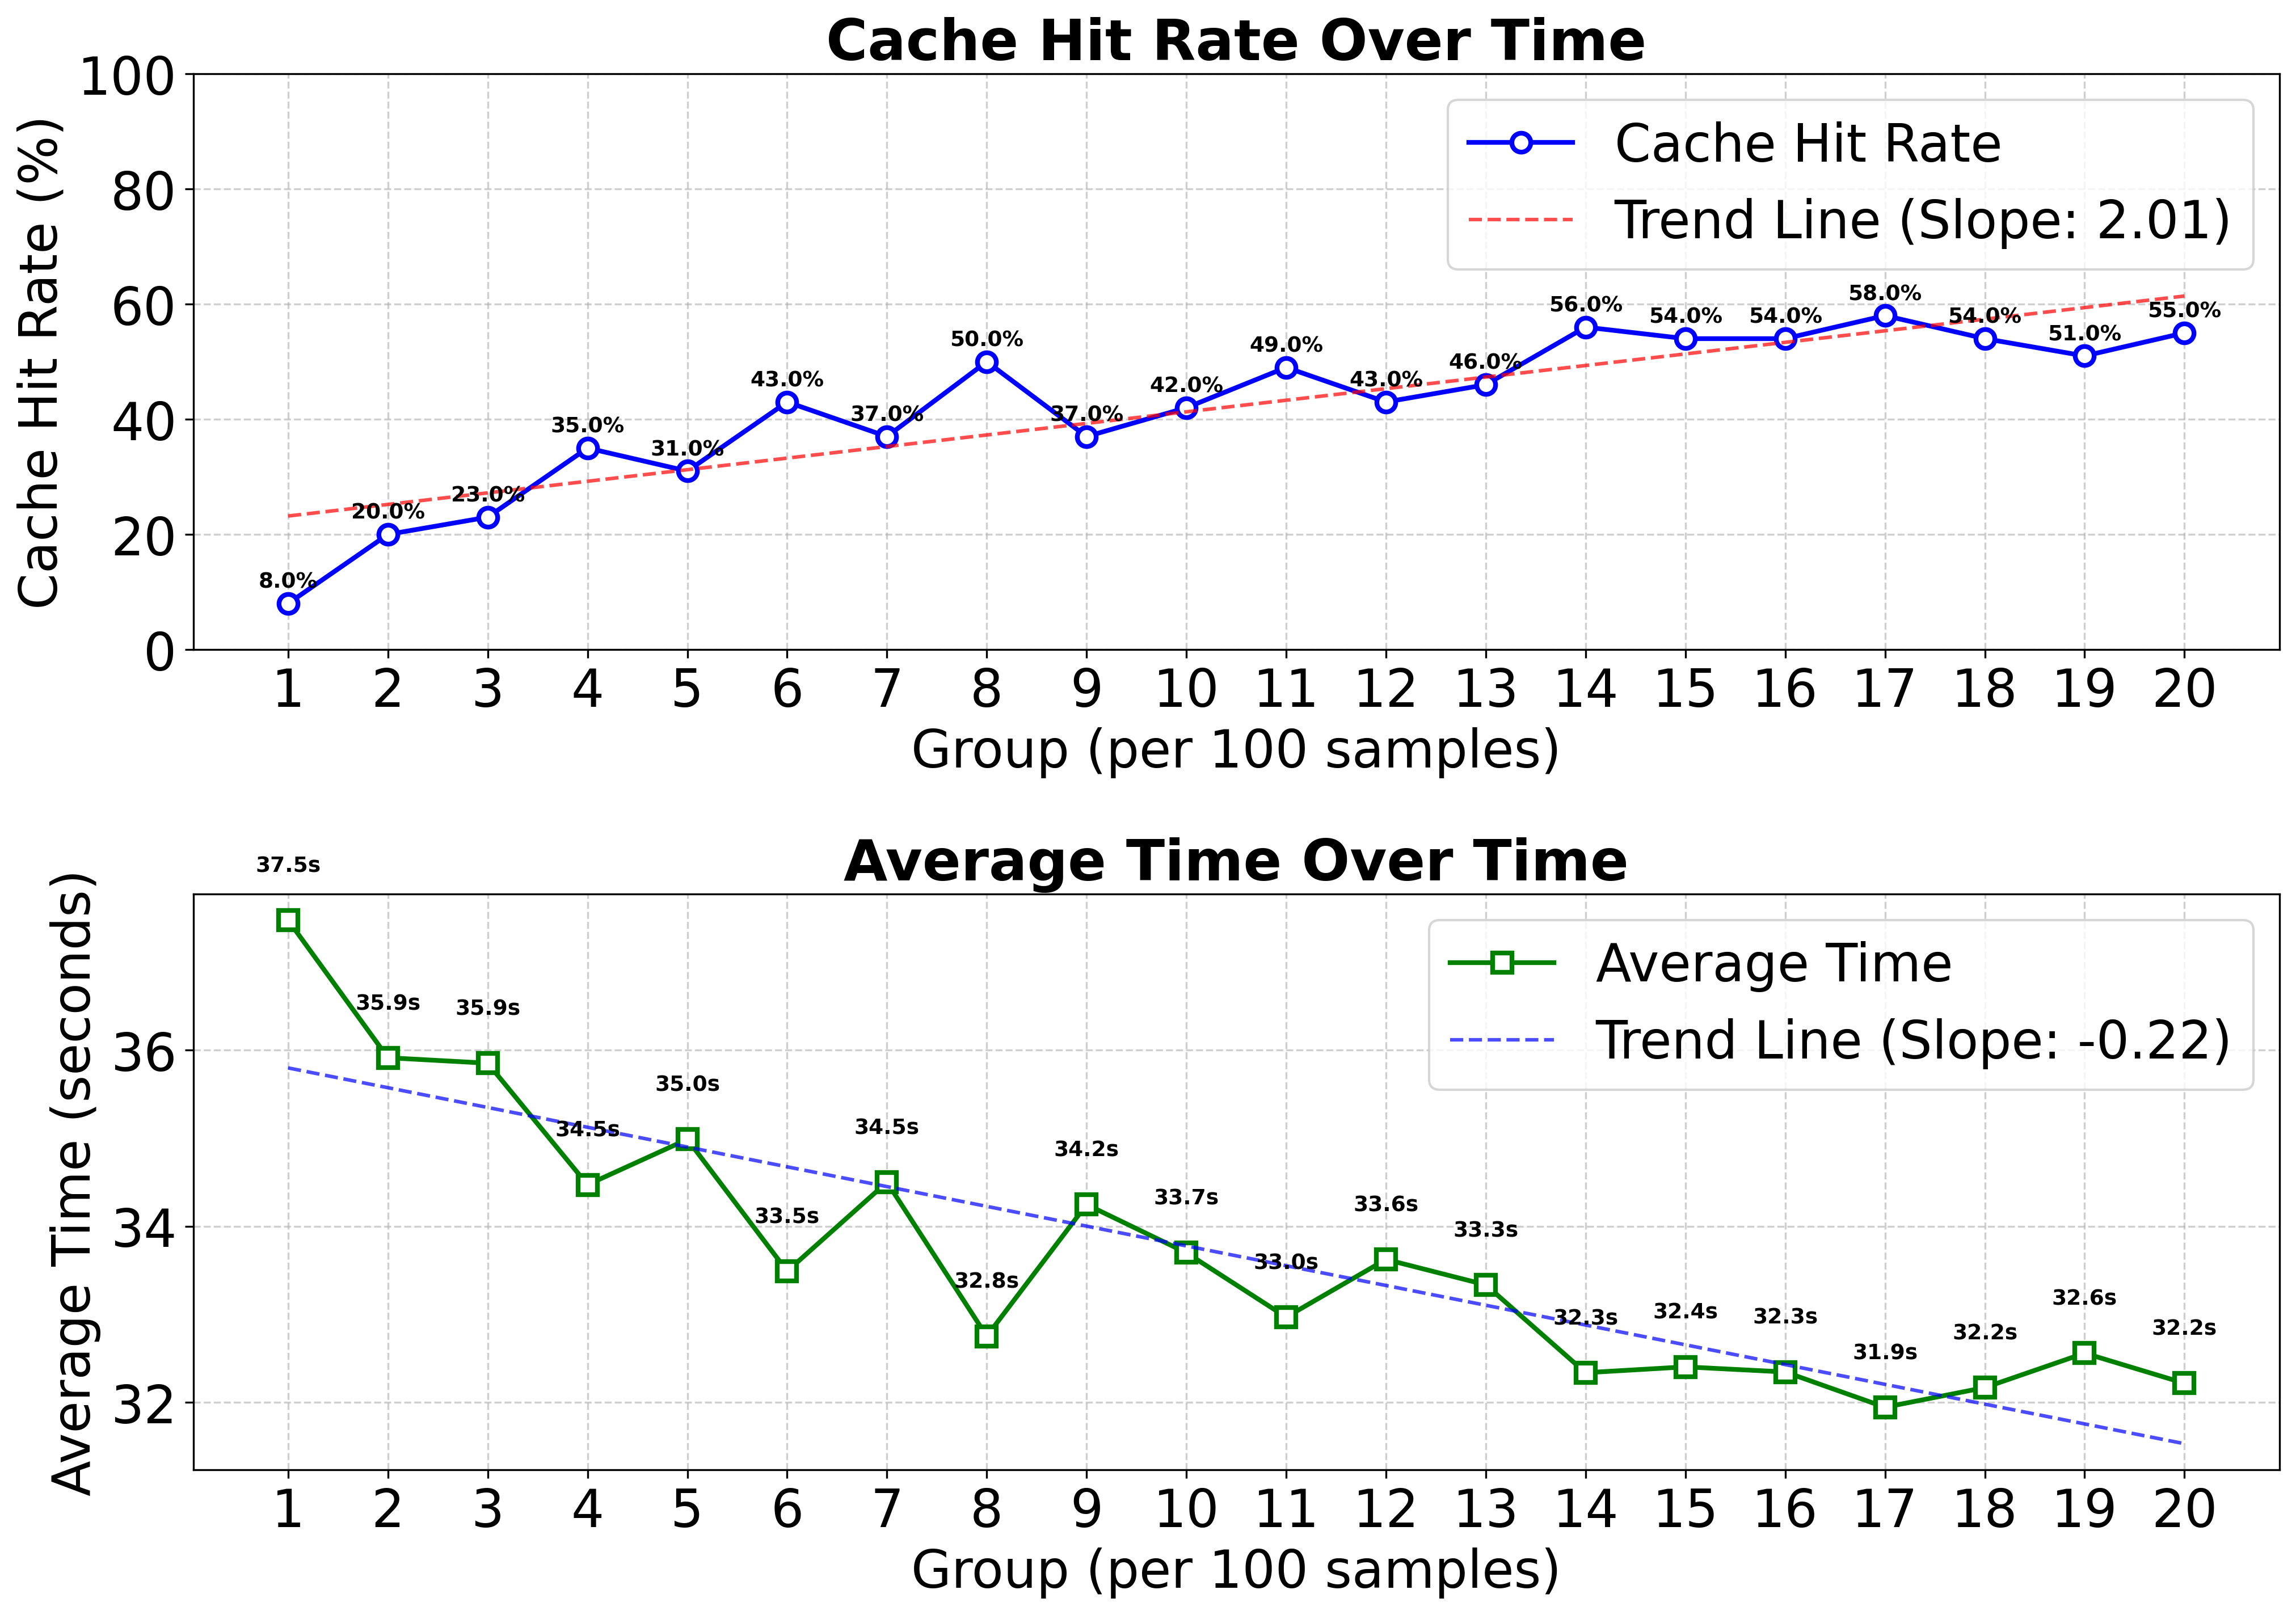
Cache dynamics under cold start. Cache hit rate and average latency as the cache grows from an empty initialization. Hit rate rises to ~50% after ~1,500 requests, driving ~1.2× speedup with the trend still improving.

System Overhead

Chorus's auxiliary modules add minimal overhead to end-to-end latency.

Latency breakdown of auxiliary modules (H20 GPU, Wan2.1-14B-distilled)
Module Latency % of Cache-Hit Latency
CLIP embedding 4.5 ms 0.01%
LLM (prompt diff) 245 ms 0.56%
DB retrieval (4K prompts) 8.5 ms 0.02%
Segmentation 786 ms 1.78%
Total auxiliary 1.04 s 2.4%
End-to-end (cache hit) 44.15 s
End-to-end (no hit) 64.0 s

⚡ Negligible Auxiliary Overhead

The total auxiliary cost is only 1.04 s, accounting for merely 2.4% of cache-hit latency. Even with all preprocessing steps included, end-to-end latency is reduced from 64.0 s to 44.15 s (≈1.45× speedup), confirming that auxiliary overhead does not offset the acceleration benefit.

Citation

If you find our work useful, please consider citing:

@article{liu2026beyond,
  title={Beyond Few-Step Inference: Accelerating Video Diffusion Transformer Model Serving with Inter-Request Caching Reuse},
  author={Liu, Hao and Huang, Ye and Huang, Chenghuan and Zheng, Zhenyi and Du, Jiangsu and Ma, Ziyang and Lyu, Jing and Lu, Yutong},
  journal={arXiv preprint arXiv:2604.04451},
  year={2026}
}